5 April 2026, 21:35 UTCSDE models of scRNA-Seq and Perturb-Seq
I've recently been exploring an Ornstein-Uhlenbeck SDE model of scRNA-Seq and Perturb-Seq. It's a simplistic model, but is enough to encounter many concrete problems that come up in stochastic models, such as parameter identifiability.
11 October 2025, 7:24 UTCk-Nearest Neighbor density
Pondering k-Nearest Neighbor density estimation. This is appealing, as it can adapt to the local density of points. However there is a little subtlety making it smooth, and ensuring the density function integrates to 1. Here is a simple scheme:
- Assign each point a radius from the distance to its kth nearest neighbor.
- Treat each point as a Gaussian splat with that radius.
- The density is the sum of all the splats.
Computing the density at a point, we need to do a query over a set of balls of different radii. So this step is no longer exactly k-Nearest Neighbors, but it shouldn't be computationally much harder.
We can also use these splats as weights for local model fitting (similar to loess curves).
Olsen, Lindrup, and Mørup (2024) describe essentially this idea. They add some elaborations such as giving each splat its own locally estimated covariance matrix. They use the term K-Nearest Neighbor Kernel Density Estimation (KNN-KDE), which is a good description.
3 May 2025, 22:23 UTCSamesum normalized log2 transformation of counts
Normalization and log transformation of log count data. Pseudocounts, library size adjustment, Centered Log Ratios (CLR), Variance Stabilizing Transformation, and all that. There are many variations on ways to achieve this, but here's something I haven't seen done:
Transform counts to log2(count/scale+1), with a scale chosen per sample such that each sample adds to the same total.
I've put an implementation in my old varistran package. There is a numerical optimization per sample, but I can apply Newton's method so it's fast. I have more testing to do to really understand how well this performs, but wanted to have implementation I could point people too.
26 December 2024, 6:14 UTCComments on "Statistical Rethinking"
I've been watching the 2023 Statistical Rethinking lecture series by Richard McElreath. These cover a complete approach to statistics based on causal reasoning and Bayesian analysis. They are excellent, highly recommend.
Some personal commentary:
- I loved the very practical understanding of the mathematics he was using. This is not a dry application of the correct statistics. He is crafting a "golem", and all its intricate joints allow it to adapt and squirm with the actual data.
- There is a lot going on. I feel like I could follow it mostly from being familiar with simpler versions of a lot of the ideas. This is a presentation of a complete package of ideas, but it would be possible to take it apart and present pieces separately. A lot of the causal reasoning to could be disentangled from the Bayesian.
- A lot of it concerns causal inference from observational data. This depends on bringing a lot of assumptions about causality, which could uncharitably be viewed as already falling into sin. However many medical and social questions only have this type of data. The causal viewpoint clarified for me what adjustments are valid and useful to make in an actual experiment too.
This was also reflected in his choice of priors. Bayesians are sometimes prone to exotic priors, but not here. Mostly normal and exponential distributions chosen to the task at hand. These are moderately informative priors, and can't be used thoughtlessly.
- He will often compare the prior and posterior distributions of parameters. A very useful check. I note this gives the viewer enough information to divide out the prior that was used on these parameters and substitute their own. Some of the author's subjectivity can be removed.
- It's interesting to compare this account of causality to Hill's criteria. As in, while they may be coherent with each other (i.e. not contradict each other), Hill places a lot of emphasis on things McElreath does not. Hill's criteria are (I think?) a decent account of actual medical policy making. How would these enter a causal/statistical analysis?: strong effect sizes and relative risk as preferred effect size, a dose-response curve, specificity, indifference to there being a known mechanism but coherence with known mechanisms, analogy. Maybe only in the interpretation at the end?
20 November 2021, 1:22 UTCDelayed webcam mirror
9 November 2021, 6:23 UTCGhostsurn
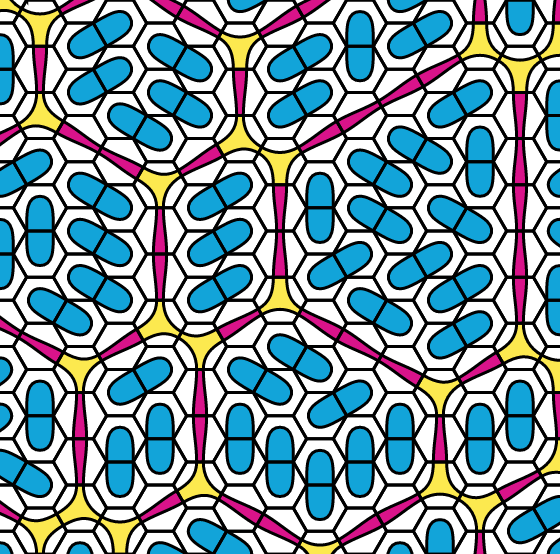
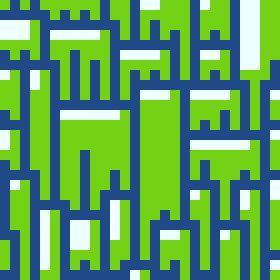
I have been working on a successor to my tile layout app Ghost Diagrams, which I am calling Ghostsurn. The novel feature of Ghostsurn is finding not just a valid example of a tile layout, but a properly random sample from the set of all possible layouts.
10 April 2021, 5:53 UTCWe've been doing k-means wrong for more than half a century
Updated 2021-06-04: The k-means++ implementation I was using previously appears to have been flawed. I've updated results using a better implementation.
The above report focusses on R. @ctwardy has replicated the basic result here and done some further exploration in Python.
Updated 2021-06-19: Added Appendix 2, sketching an argument that the asymptotic density of k-means++ is optimal.
27 September 2020, 0:23 UTCk-means the diversifier, the deviralizer
For a collection of points, the k-means algorithm seeks a set of k "mean" points minimizing the sum of squared distances from each point to its nearest mean. k-means is a simple way of clustering data. It has a fast approximate algorithm to find a local optimum, but this might not be sufficient for the application I am talking about here, which needs something like a truly global optimum. It can also be viewed as a way of approximating a dataset using a smaller number of points, even if it does not consist of distinct "clusters".
I've recently become interested in the behaviour of k-means for large k. What is the distribution of the means compared to the original distribution of vectors, as k becomes large but assuming n is always much larger?
In one dimension Wong (1982) has shown that the density distribution of means is proportional the cube root of the original density distribution. Raising a density to a fractional power such as here 1/3 has a flattening, widening effect. Peaks are lowered and tails are fattened. After some rough calculation (see end), in d dimensions I believe the distribution will be proportional to the original distribution to the power d/(2+d). Altering the distance metric (k-medians, etc) I think will result in a different power.
So, for any collection of things where we have a notion of distance, k-means provides a way to flatten and summarize the distribution. (If we don't want to interpolate, we could limit means to members of the original collection.)
In a collection in which most of the variation is only in a subset of dimensions I think the effective d will depend on k. For example, for moderate k the effective dimension might be 1 or 2, but for large k one gets into the fine structure, the effective d rises, and the flattening effect is reduced.
This idea of flattening a distribution seems useful, so an algorithm that does it is exciting:
- From a news feed, pick items covering the diversity of opinions. Do not concentrate too much on wild outliers, but also do not concentrate too much on the most common themes.
- In a shop, stock items to maximize the average ability to meet the needs of customers. Some stocked items will have higher turnover than others.
- Looking to employ k people, choose a set of people who will bring diverse skills. For tasks that arise we want to ensure we've employed someone with skills fairly well matching the task. We have an anticipated distribution of tasks. The possible "means" are the available applicants.
It also seems reminiscent of Wikipedia pages, which tend to cover all the major opinions, not including wild theories but also not entirely focussing on the dominant theory.
Update 2020-10-24: I've applied this idea by clustering 2020 bioRxiv abstracts. This uses a "greedy" variant of k-means where means are optimized one after the other. In other words, it is an ordered list in which topics become progressively more specialized. The algorithm I used also has fairly good ability to escape local optima.
Further note 2021-03-23: The usual k-means algorithm performs very poorly at finding the global optimum, or even at producing clusterings with the expected properties I have described the global optimum as having. Some improvement may be obtained by initializing cluster membership using Ward agglomerative clustering. In R, use fastcluster::hclust.vector() followed by cutree().
In one dimension, obtain the exact global optimum with Ckmeans.1d.dp::Ckmeans.1d.dp().
Appendix: A very rough examination of what happens in d dimensions.
Consider two d-dimensional unit hypercubes, containing n1 and n2 points respectively.
Out of k, how shall we allocate the means to the two hypercubes, k1, k2=k-k1?
Within a hypercube, the distance to the nearest mean will typically go proportional to k^(-1/d).
So within a hypercube the sum of squared distances will go approximately like
SS = c (k^(-1/d))^2 n
   = c k^(-2/d) n
where c is some constant.
Within two hypercubes we would have
SS = c k1^(-2/d) n1 + c (k-k1)^(-2/d) n2
Assuming k is large enough that we can treat it as effectively continuous, find the minimum by differentiation:
dSS/dk1 = c n1 (-2/d) k1 ^(-2/d-1) - c n2 (-1/d) (k-k1)^(-2/d-1)

Set dSS/dk1 = 0
=> n1 k1^(-2/d-1) = n2 (k-k1)^(-2/d-1)
=> (k1/(k-k1))^(-2/d-1) = n2/n1
=> ((k-k1)/k1)^(2/d+1) = n2/n1
=> (k2/k1)^(2/d+1) = n2/n1
=> k2/k1 = (n2/n1)^(1/(2/d+1))
=> k2/k1 = (n2/n1)^(d/(2+d))
This shows how k means will be allocated between two regions of differing density. Between more regions, each pair of regions will be balanced in this way.
10 March 2020, 19:22 UTCSlides from a topconfects talk at WEHI
This is a somewhat extended talk I gave at the Walter and Eliza Hall Institute. It goes into some more details about how confect values behave. The gene-set enrichment section is also an improved method that uses an effect size that is a linear function and no longer needs bootstrapping.
30 November 2019, 23:14 UTCSlides for topconfects talk at BiocAsia 2019
These are slides for a 15 minute presentation on my topconfects Bioconductor package, for BiocAsia 2019.
New material for this presentation is the application to gene set enrichment measurement.
21 August 2019, 23:43 UTCSlides from a talk putting Topconfects in context
7 August 2019, 22:25 UTCE(f(rarefied count)) for consistently biassed transformation
16 February 2019, 21:03 UTCLorne Genome 2019 poster - weighted principal components and canonical correlation with single cell data
27 December 2018, 6:32 UTCRecommender systems and the viral bubble
13 October 2018, 0:27 UTCBall hypothesis tests
5 October 2018, 11:17 UTCWeighted least squares
9 March 2018, 10:59 UTCDetermining the sign of an effect size is quite similar from Frequentist and Bayesian perspectives
8 November 2017, 5:34 UTCTopconfects talk
28 October 2017, 3:55 UTCScatter plots with density quartiles
29 May 2017, 23:28 UTCMelbourne Datathon 2017 - my Kaggle entry
1 April 2017, 22:58 UTCDiagrams of classical statistical procedures
16 March 2017, 23:29 UTCFinding your ut-re-mi-fa-sol-la on a monochord, and making simple drinking straw reedpipes
18 October 2016, 5:53 UTCShiny interactivity with grid graphics
7 August 2016, 2:17 UTCCrash course in R a la 2016 with a biological flavour
17 July 2016, 1:45 UTCVectors are enough
28 May 2016, 22:04 UTCSci-Hub over JSTOR
4 November 2015, 23:41 UTCComposable Shiny apps
14 September 2015, 4:39 UTCRecorder technique and divisions in the 16th century
30 July 2015, 0:04 UTCLinear models, a practical introduction in R
7 May 2015, 5:47 UTCWhen I was a young lad in the '90s
